Technology and Transit: Strengthening TOD With GIS (Part 3)
It was a great honor for me to present my Kagan research project at the annual RTKL Design Conference in Miami, in front of the talents from our firm’s different offices across the globe. Although I did expect a more formal setting for my presentation, it turned out that I really enjoyed the conversational interaction with the group. The conference attendees showed great interest in my topic and research. They shared their experiences and thoughts about public transit and how people connect to places in their own cities. I believe I received great feedback that I can definitely incorporate into my next phase of research. I am also glad to see that people started to think differently on how they get around the city and recognized the importance of multi-modal transportation. I feel encouraged and inspired to continue my efforts on my Kagan project.
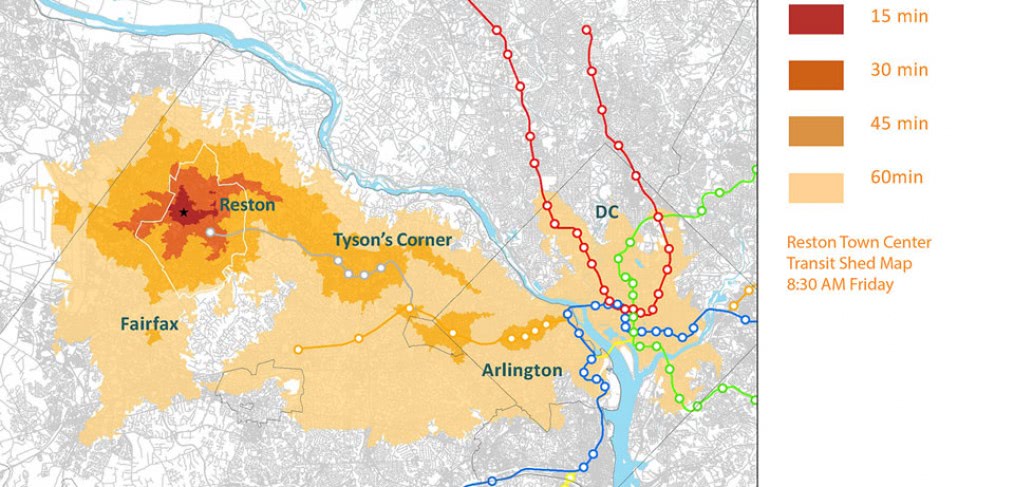
One of the most important slides in my presentation was the Transit Shed Map created for Reston Town Center. It also generated the most discussion and feedback during and after my presentation. In my last blog post, I briefly explained how I was going to map out the transit shed. I further elaborated on the methodology and resources I used in my presentation. Two types of open data have been involved in my project so far. I acquired the GTFS data from public transit agency websites. I also downloaded the street network base map from OpenStreetMap. The primary analysis tool is the ArcGIS network analyst. It took a lot of effort to figure out how to convert the downloaded open data into the GIS recognizable format. After several rounds of tests, experiments and adjustments, I was happy to be able to present the Transit Shed Map at the Design Conference. I believe it’s a powerful visual reference that clearly shows how transit can play an important role in connecting people to their desired destinations.
I am also very grateful for the numerous good suggestions I received about how I can make this project more useful and impactful for our design work. Some suggested that I could think in a reverse way, like mapping out the areas within 30 minutes via transit to one particular destination. In that case, we could use any design project site to evaluate how accessible it is by transit. Other people suggested that I could compare different modes. For example, I could compare how quickly a destination can be reached by car or by public transit at a certain time of the day. This could demonstrate the benefit of taking public transit at a rush hour.
I took notes on these brilliant ideas right after my presentation. I really appreciate all the feedback and welcome any comments or questions posted below. For my next step, I will try to incorporate the feedback and test some of the ideas. The Design Conference offered me a great chance to exchange ideas and meet people. It definitely created a lot of memorable moments for me. Also, it encouraged me to explore the possibilities and made me further believe that as members of RTKL’s design community, we have the ability to make key connections to people, places and design projects that enhance the world.
CallisonRTKL
Latest posts by CallisonRTKL (see all)
- Learning the Language of Sustainability - October 17, 2017
- Renting Isn’t Just for Millennials Anymore - January 10, 2017
- Off the beaten path: is an architectural revolution in store for Cuba? - January 5, 2017
- Holiday Gift Ideas for your Mother (Earth) - December 16, 2016
Very interesting presentation, Le An! Congratulations. I visited the Fairfax-Washington area for family visit and tourisme, this summer. it realy takes a long time to get to downtown DC by car. Often, public transport or a combination of car and metro is faster, we found out.
In the Netherlands, we have a fine website, showing transit times to and from locations. Unfortunately, only in Dutch. But the maps are very similar to the results of your research project. Check http://www.bereikbaarheidskaart.nl/, tab ‘Bereikbaarheid / Reistijdisochronen’ (accessability / lines of equal travel time). You can choose between public transport (OV) and privat (Auto). Furthermore, one can choose between rush hour (ochtenspits) or lee-hours (daluren), current layout and future situation (year 2020). Have fun!