Design Goes Social (Part 2)
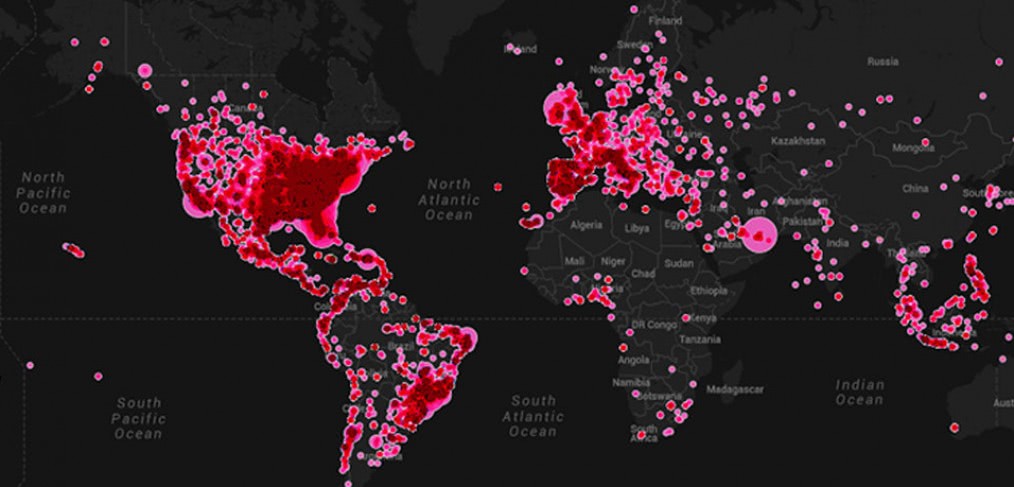
As I’ve been working through these last few months, I’ve come to realize that my “big idea” is huge! Measuring social impact through social media sounds easier than it is. I mean, I knew there would be noise out there, but until you’ve seen one billion of anything, you just can’t appreciate it. My job is to cut through the noise and get at something substantive. The alignment of RTKL’s expressed social values and this mountain of data is the core problem I face.
SOCIAL VALUES
My research into the “why” of social media has revealed some interesting facts about the human race’s love of all things social. Whether we are tweeting, posting, snapping, or checking in – we are saying something, aren’t we? To recap, our stated values for social impact are Usability, Community, Equity, Health & Well-Being, and Public Health. Five easy-to-understand principles with a near impossible limit to what they mean. How does one shown an agreement between such broad goals and someone posting about a sandwich?
USABILITY
The ease with which a building can be used
Did you know that mentions and replies account for 2/3 of all activity on Twitter? As a design firm, we don’t have the luxury of people interacting directly with our brand, so how do we know whether people are “using” our spaces? Many of our clients create official handles and pages for the projects we design. Direct engagement with that brand is something we can leverage. Usually, even if there is not an official channel, a hashtag is created by the parent company to discuss official business. This is crucial in determining usability because when people go out of their way to mention a brand, they want that brand to understand their joy or frustration.
COMMUNITY
An active social network
By its very definition, community longs for social engagement and by virtue of that, should be the easiest to measure. How many “likes” does the official brand have? Check-ins? Followers? By simply counting people who voluntarily associate their personal lives with a brand or location, we can accurately gauge involvement. This is true whether a user mentions the brand directly or not, but more on that later.
EQUITY
Equal opportunity for fair treatment
How can social media help here, you ask? I will tread lightly with my answer. According to the latest studies (Business Insider, Pew Research) we tend to operate in social media spheres according to our demographic. Basically, if our friends are there, we want to be there too. In order to measure equity, however, I would like to focus less on “who” is using Twitter, and more on are our spaces getting equal treatment across multiple sites. Taking a look at four RTKL projects across 3 popular social media sites, you can start to see trends regarding interaction with those projects across different media. This is telling, not because women are heavier Facebook users than men, but because we can begin seeing how different kinds of people, based on their preferred social site, access our spaces. 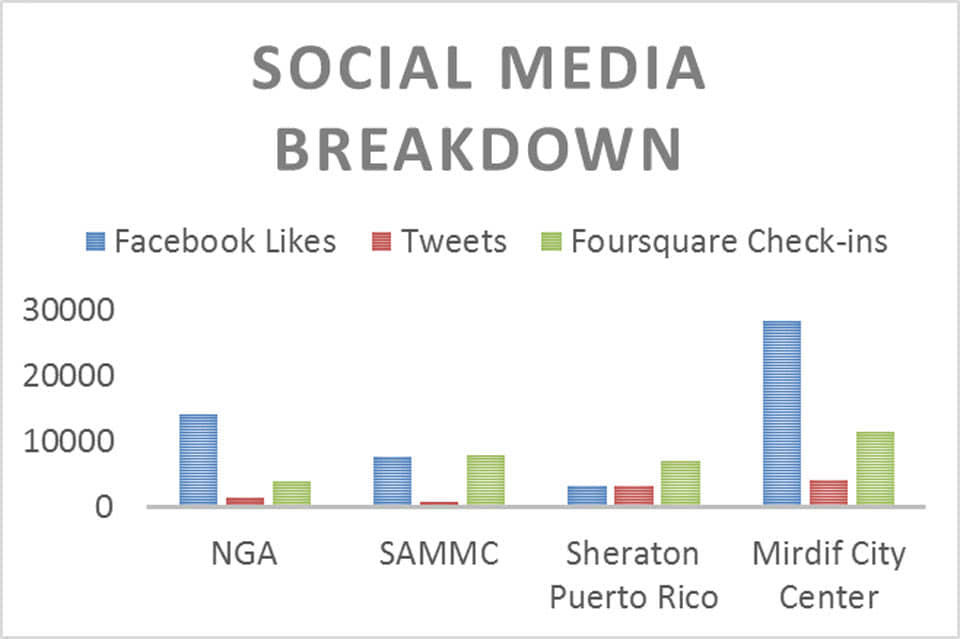 HEALTH & WELL-BEING
A person’s physical, mental, and emotional state
Many people, smarter than me, are looking to the internet to measure the “mood” of America. Most of these inferences are based on some highly sensitive algorithm that looks for the tone of a post or looks for keywords that indicate how someone feels. Whether they are counting “smiley vs. frowny faces” or looking into the time of day a user posts, this data is highly useful. With the additional knowledge of where a user is when they make their comment, RTKL can perhaps begin to understand how our projects make them feel.
PUBLIC HEALTH
The physical state of the general population
Where are you? Why are you checking in? If I enjoy a place and want others to know that I am enjoying a place, assumptions can be made about how safe I feel there. Watching people check in to our projects is enlightening, and agreeably, a little creepy. However, creating spaces that people want to be in is what we do for a living and as designers, how else can we know? How is the brand that occupies our space incentivizing interaction? How are the people responding? Are check-ins increasing or decreasing in volume? These metrics are telling us a lot more than just “Hey, this sandwich is awesome!”
WHAT’S NEXT
I’ve created a Grasshopper script to lay out the logic of how I want my custom search tool to work. Using plugins with names like Mosquito, Lunchbox and Elk, I’ve worked to create a flow that first identifies the project location, then for specific terms or tweet counts from around that location. That data can then be mapped to Google or exported to a spreadsheet for charting. This exercise taught me more than I was prepared to learn about the limitation of public APIs. Twitter only allows you to search back 4 weeks at a time, for instance. That means when the tool is turned on for the first time, our data will grow from that point on. Not a game killer, but certainly a game changer.
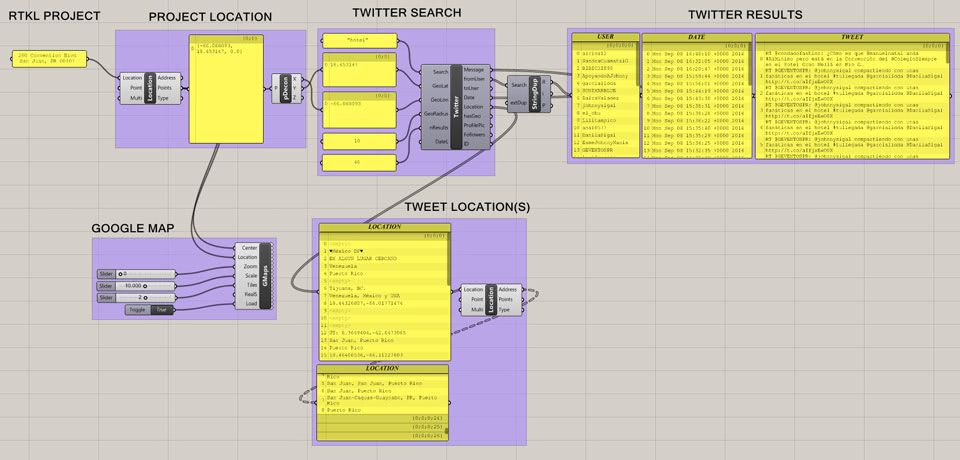
Figure 2 – Da Funk
IN CONCLUSION
These next few months will be very interesting as I begin taking what I’ve learned and implementing these ideas into a working tool. I am no programmer, but I hope to have a working proof of concept by year’s end. I may limit the number of social media outlets and the number of projects to stat with as data comes easily and in tremendous amounts, but my hope is that you will see, as I do, the value free information brings to us. Stay tuned!
CallisonRTKL
Latest posts by CallisonRTKL (see all)
- Learning the Language of Sustainability - October 17, 2017
- Renting Isn’t Just for Millennials Anymore - January 10, 2017
- Off the beaten path: is an architectural revolution in store for Cuba? - January 5, 2017
- Holiday Gift Ideas for your Mother (Earth) - December 16, 2016
Very Cool. Are you using Grasshopper to plot and aggregate your data or are you using ARCGIS or another similar tool? Interested in learning more about your process.